Silicon IP Cores
Lossless Compression Efficiency of JPEG-LS, PNG, QOI and JPEG2000: A Comparative Study
By Dimitrios Bozikas, CAST
Abstract
Determining the best fitting lossless image format for a specific application is a process involving the examination of multiple variables in order to make an informed decision. From the compression ratio a codec is able to achieve for a specific image type, to algorithmic complexity, speed or memory requirements for a software application, to size and power requirements for a hardware implementation, all constitute deciding factors that will shape the form of the final product. In this paper we attempt to compare the achievable compression ratio of four lossless image formats across a data set of 2814 images exhibiting high variance in their key characteristics. The results are then categorized based on the image type to further illustrate the potential effectiveness of each image format for specific use cases.
Introduction
The continuous trend of increasing the image resolution in the majority of commercial and professional applications necessitates an ever-evolving set of solutions that facilitate the efficient encoding of images, reducing their size without compromising on quality. From state-of-the-art 4K and 8K video, to ultra-low-power applications, the ratio between the raw image data size and the encoded image size is considered one of the primary metrics to determine the effectiveness of each format, as it is the deciding factor for the storage, and bandwidth in the case of real-time processing, requirements of the application.
Compression ratio (CR) may vary between image formats, as well as the type of image data. Selecting the appropriate format for the target data type might become crucial to the performance of the entire application. With the introduction of novel image formats, such as QOI, the Quite OK Image format [1], along with the continuous improvement of existing formats and implementations, measuring the performance of each format for data sets displaying a significant variance in image types is a useful guide to determine the correct codec to pair with each application.
Methodology
The methodology used to assess the CR of each format aimed at establishing a point of reference common to all codecs, regardless of the initial encoding of the chosen image set. As such, all images were encoded to raw RGB format, which was subsequently used as the point of reference for all compression measurements. Since JPEG-LS and JPEG2000 do not support an alpha channel, a filter mapping the alpha channel to a white background was applied during the RGB encoding process.
All conversions were performed using FFMPEG [3] for its wide array of proven codecs. The reference implementation of QOI [2] was used for QOI encoding specifically. Table 1 details the settings used for each codec, while further implementation information can be found at the benchmark github repository [6].
|
Format |
Software |
Version |
Codec |
Flags |
|
RGB24 |
FFMPEG |
N-106935-gb8ede4d637 |
rawvideo |
-pix_fmt 24 |
|
PNG |
FFMPEG |
N-106935-gb8ede4d637 |
png |
-pred 5 |
|
JPEG-LS |
FFMPEG |
N-106935-gb8ede4d637 |
jpegls |
- |
|
JPEG2000 |
FFMPEG |
N-106935-gb8ede4d637 |
libopenjpeg |
- |
|
QOI |
qoiconv.c / stb lib |
commits 0x75e7f30/0xaf1a5bc |
- |
|
The steps for measuring the CR for each format are the following:
- The original image is converted to 24-bit RGB format with the alpha channel removed in order to create a baseline image.
- The raw RGB image is encoded to PNG, JPEG-LS and JPEG2000 using FFMPEG according to Table 1.
- The encoded PNG from the previous step is used as an input to the QOI encoder, since the latter does not have raw RGB support.
- The compression ratio of each format and for each image is calculated as:
- The average compression ratio is calculated for each image set consisting of N images as:
- Finally, the aggregate compression ratio for each image set is defined as:
Datasets
The primary dataset used for the measurements was the one assembled and provided through the QOI benchmark [4]. The dataset was selected due to the presence of a wide array of images covering various use cases, from natural images and photographs, to artificially produced images, screenshots, icons, textures and various objects. A handful of images from this dataset were removed due to their small dimensions causing issues with the JPEG2000 codec setup. In addition, one image that, after alpha removal, was encoded to a white only canvas was also removed from the tests. The dataset was complemented by the inclusion of the 8-bit RGB variants of the high-quality New Test Images [5]. A full list of the images is provided in the benchmark’s github repository [6].
The images and results reported are organized in the same manner as with the QOI project compression rate benchmark report [4]. The naming convention for the groups follow the directory structure of the image library, namely icon_64, icon_512, photo_kodak, photo_tecnick, photo_wikipedia, pngimg, screenshot_game, screenshot_web, textures_photo, textures_pk, textures_pk01, textures_pk02 and textures_plants. The images from the New Test Images dataset [5] are referred to as rgb8bit. Additionally, results are also reported for the images categorized in the following broader groups:
- Natural images include photographs of the natural world.
- Artificial images include computer-generated graphics, be it images or various screenshots with varying degrees of complexity.
- Icons and Objects include various UI icons and images of singled out objects. Objects themselves may be artificial or natural objects displayed over a white background.
- Textures include various images of textures used in 3d graphics processing. The textures include both photographs of surfaces, plants or synthetic images, while some are separated into their different components, such as diffusion or height maps.
Results
The results of the compression ratio benchmarks are organized first by category. A summary is provided for each category and set. The highest compression ratio result is excluded from the bar graphs for the sake of legibility as, in many occasions, it can be orders of magnitude larger than the average and aggregate values. Similarly for scatter plots, some extreme values may occasionally be omitted from the diagram for clarity, while a second diagram focusing on a smaller subgroup of images may be present to further increase legibility. The detailed results of the benchmark are also provided in the benchmark’s github repository [6], should the reader wish to take a more analytical glance at the numbers.
Natural Images
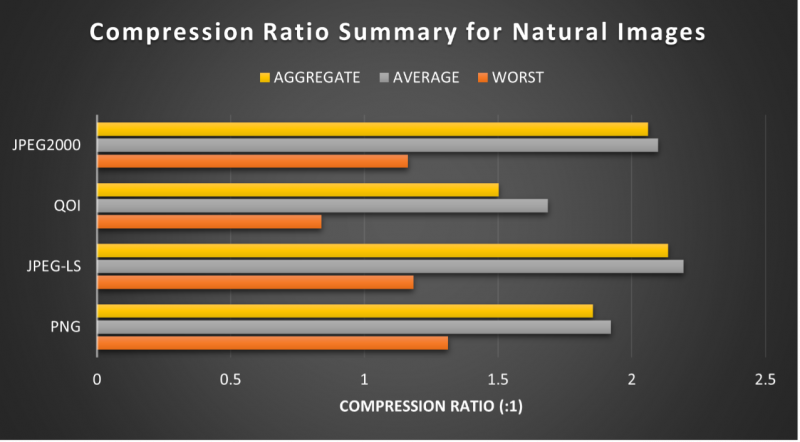
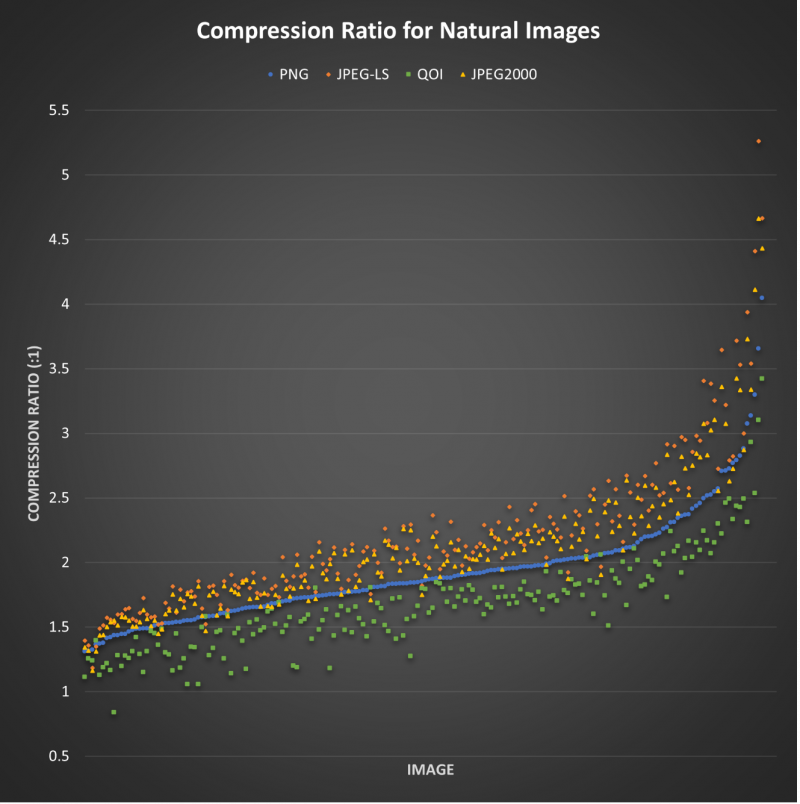
The natural images category consists of 186 images taken from the photo_kodak, photo_tecnick, photo_wikipedia, and rgb8bit image sets. The summary of this category is presented in Table 2 as well as Figure 1, while Figure 2 illustrates the compression ratio per image per format of the entire category.
This category features photographs of the natural world. JPEG-LS and JPEG2000 achieve the highest CR on the majority of samples. PNG is not favored at this particular category, while QOI falls slightly further behind, yet still represents a viable option for compression. Small variance is observed between the average, aggregate, best and worst cases for each format, while there is a consistent ordering of the formats between the average and aggregate values.
|
Format |
PNG |
JPEG-LS |
QOI |
JPEG2000 |
|
Best (x:1) |
4.046 |
5.262 |
3.421 |
4.662 |
|
Worst (x:1) |
1.312 |
1.184 |
0.839 |
1.163 |
|
Average (x:1) |
1.922 |
2.194 |
1.686 |
2.099 |
|
Aggregate (x:1) |
1.855 |
2.136 |
1.502 |
2.061 |
Artificial Images
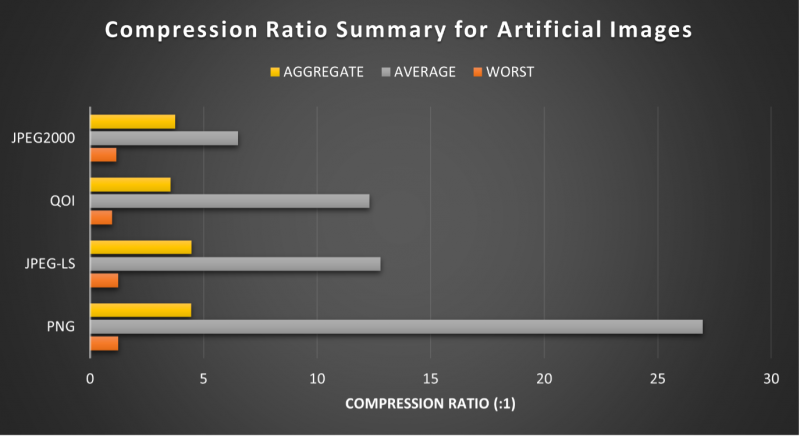
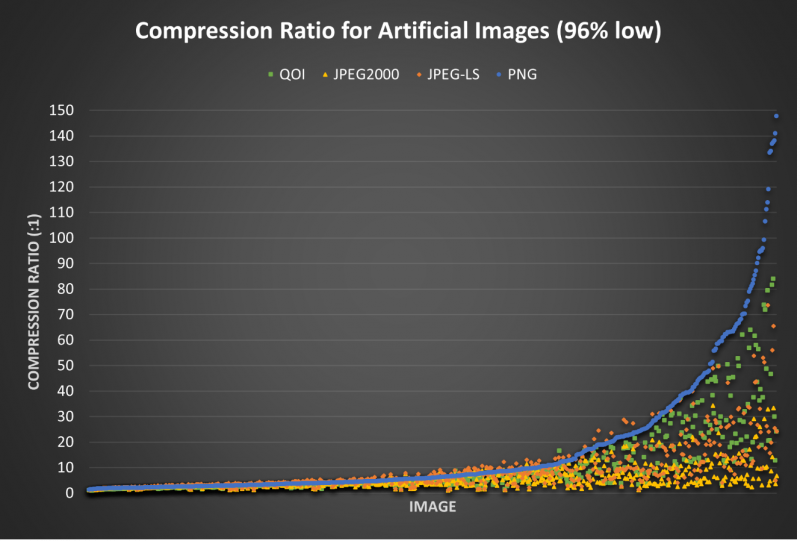
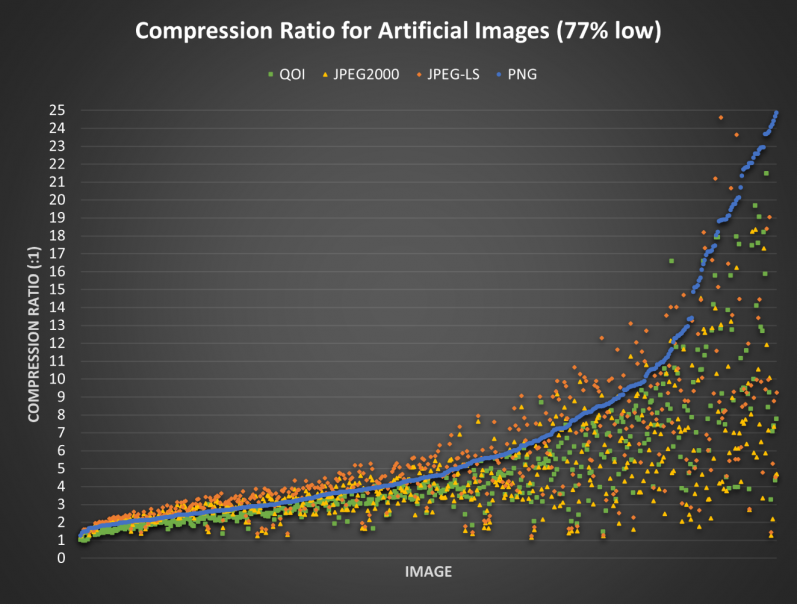
The artificial images category consists of 613 images taken from the rgb8bit, screenshot_game and screenshot_web image sets. The summary of this category is presented in Table 3 as well as Figure 3, while Figure 4 and Figure 5 illustrate the compression ratio per image per format of the entire category.
This category is comprised of computer-generated images and screenshots. On average, PNG outperforms the other formats with JPEG-LS and QOI performance being comparable. Images that may be identified as more compressible seem to favor PNG and QOI, while JPEG-LS and JPEG2000 can potentially be on par with the other two formats for images of this category that are harder to compress. Larger variance between the minimum and maximum CR is observed, with the best result being up to two orders of magnitude larger than the worst for each format. The difference is more pronounced in the upper 25% of the CR results, with PNG performing significantly better for these particular images. This is also the reason for the average compression ratio of the PNG encoding being two or more times that of the average of each other format. Aggregate results between PNG and JPEG-LS do not exhibit significant difference, suggesting that more complex images are as encoded with JPEG-LS as efficiently as with PNG.
|
Format |
PNG |
JPEG-LS |
QOI |
JPEG2000 |
|
Best (x:1) |
493.061 |
417.311 |
152.801 |
187.735 |
|
Worst (x:1) |
1.235 |
1.237 |
0.973 |
1.164 |
|
Average (x:1) |
26.976 |
12.794 |
12.308 |
6.517 |
|
Aggregate (x:1) |
4.448 |
4.470 |
3.544 |
3.753 |
Objects & Icons
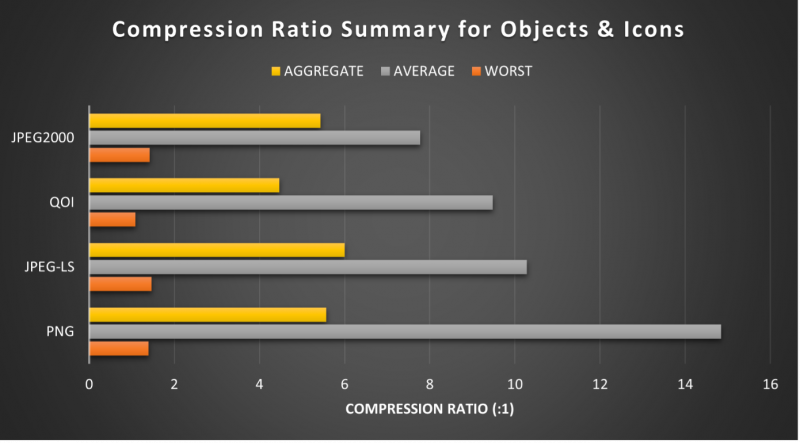
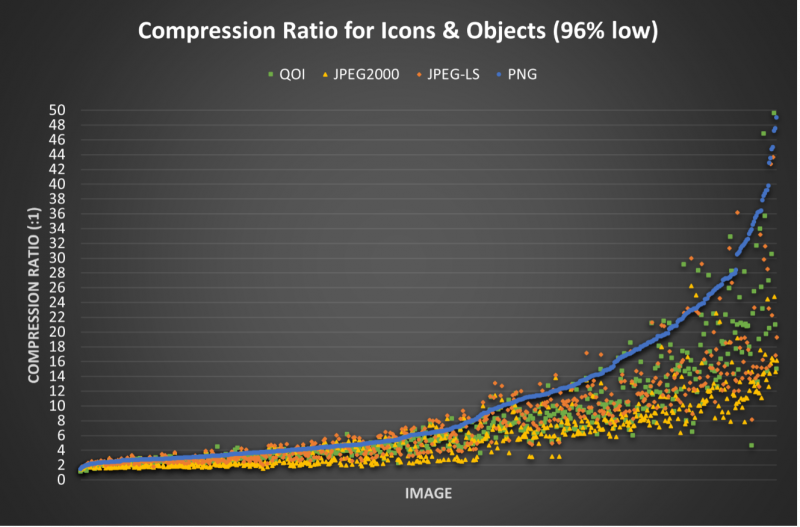
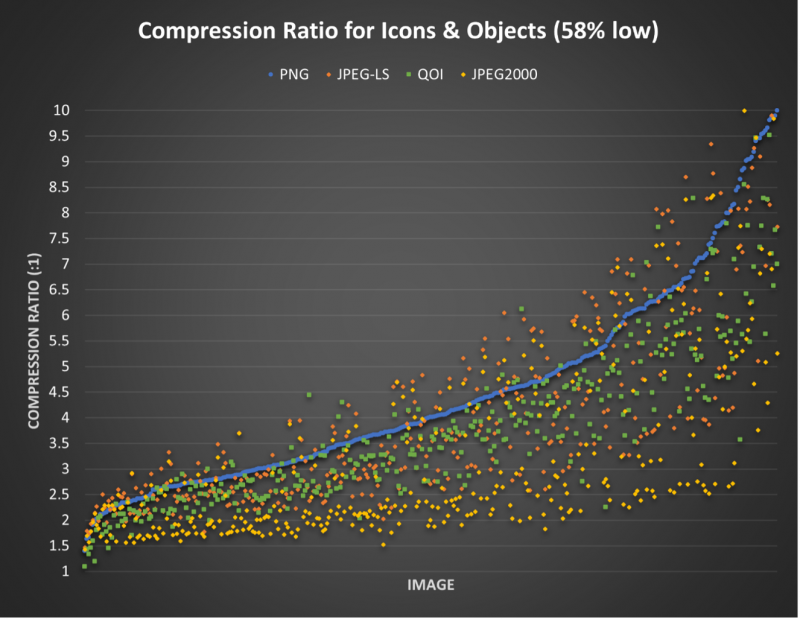
The objects and icons category consists of 612 images taken from the icons_64, icons_512 and pngimg image sets. The summary of this category is presented in Table 4 as well as Figure 6, while Figure 7 and Figure 8 illustrate the compression ratio per image per format of the entire category.
This category is comprised of both natural and artificial images of objects, such as cropped items of various complexity and UI icon elements. Results for this category are comparable to the Artificial Images, albeit with less pronounced differences between the formats. The inclusion of some natural objects seems to favor JPEG-LS and JPEG2000 at this instance, even if the image background is largely uniform. JPEG2000 outperforms QOI for this reason, but PNG still provides the best CR on average. Aggregate results favor JPEG-LS in this instance, with JPEG2000 and PNG performing comparably.
This suggests, again, that PNG achieves a better CR on images that are highly compressible, as well as smaller images such as simple icons, which constitute a large part of this dataset. JPEG-LS, on the other hand, performs better on larger and more complex images, such as some of the natural objects present in this category, resulting in higher CR when calculated byte for byte across the entire category.
|
Format |
PNG |
JPEG-LS |
QOI |
JPEG2000 |
|
Best (x:1) |
620.556 |
424.088 |
160.617 |
674.315 |
|
Worst (x:1) |
1.397 |
1.470 |
1.090 |
1.426 |
|
Average (x:1) |
14.837 |
10.284 |
9.478 |
7.777 |
|
Aggregate (x:1) |
5.568 |
6.002 |
4.467 |
5.428 |
Textures
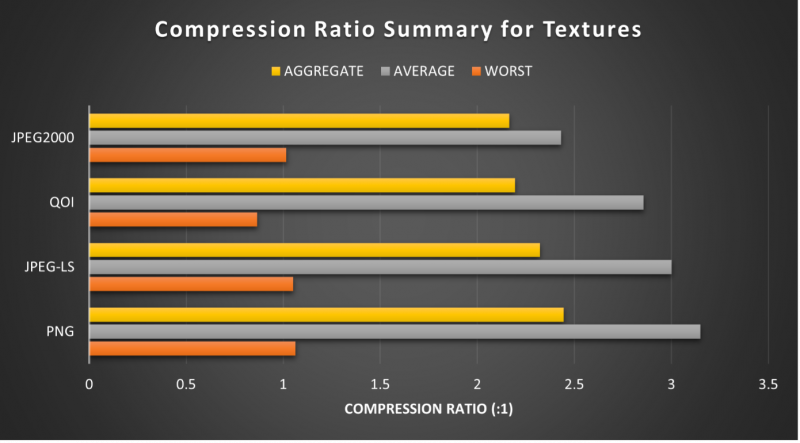
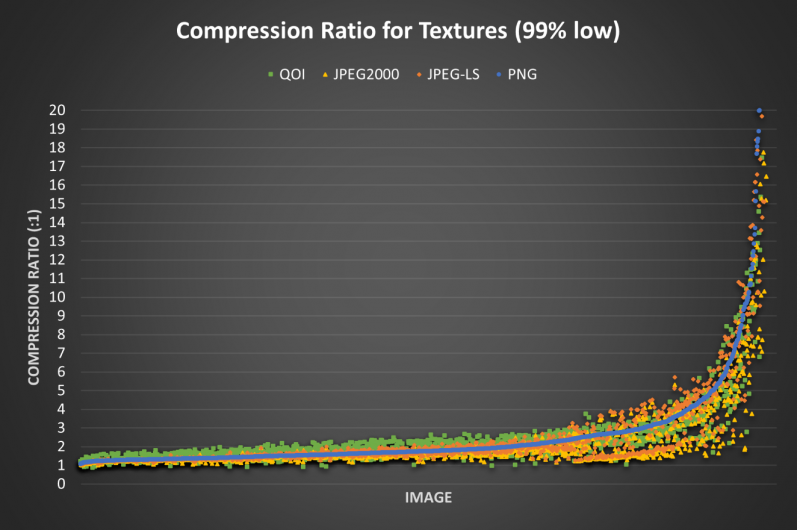
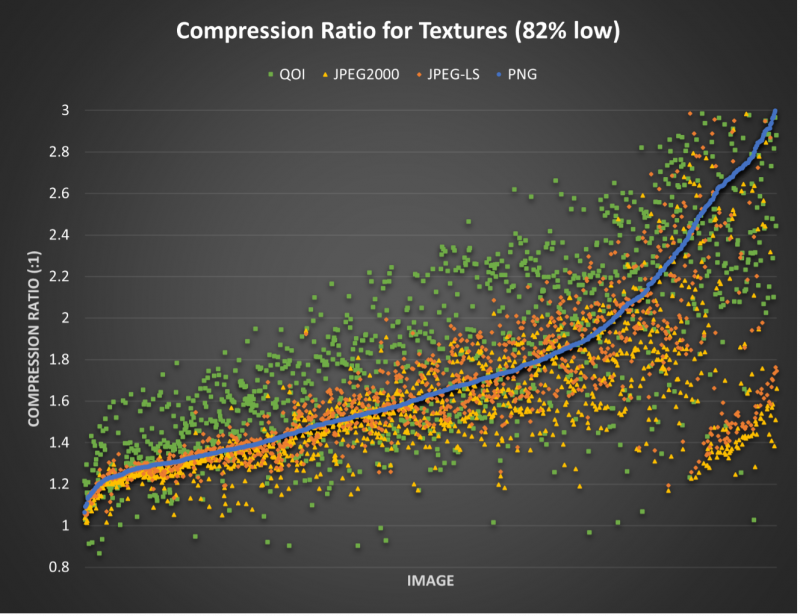
The textures category consists of 1385 images taken from the textures_photo, textures_pk, textures_pk01, textures_pk02 and textures_plants image sets. The summary of this category is presented in Table 5 as well as Figure 9, while Figure 10 and Figure 11 illustrate the compression ratio per image per format of the entire category.
This category is comprised of both natural and artificial images used as textures for computer generated objects, such as 3D models. PNG is favored over JPEG-LS by a close margin, even though the different texture sets exhibit a variety of natural and synthetic images. Examining the individual image sets presented later in this document should provide a clearer picture in this matter. QOI performs well in less compressible images in this category, although, the latter two formats surpass it as less complex images are examined. The distance between the worst and best cases is one more time noticeably large for all formats. However, approximately 80% of the sample images resulted in a CR around or smaller than the average value.
|
Format |
PNG |
JPEG-LS |
QOI |
JPEG2000 |
|
Best (x:1) |
214.170 |
270.066 |
126.355 |
128.881 |
|
Worst (x:1) |
1.063 |
1.051 |
0.865 |
1.015 |
|
Average (x:1) |
3.149 |
3.001 |
2.857 |
2.432 |
|
Aggregate (x:1) |
2.444 |
2.322 |
2.193 |
2.164 |
Conclusions
Concluding this benchmark, selecting the appropriate image format based on the data type of the application can be a pivotal point in its final implementation. While the compression ratio for less compressible images is not as sensitive to the different formats used, images that favor compression, and therefore will yield higher benefits from the process, tend to exhibit a preference to a specific codec, depending on the image type.
For artificial images, and images with less complexity and more uniform areas in general, PNG remains the preferred format. Natural images, on the other hand, where complexity is elevated due to the frequent change in colors and color shades, JPEG-LS constitutes a better solution than the rest of the formats, with JPEG2000 closely following. QOI does not appear to quite match the performance of the rest of the examined formats. However, given the simplicity of its specification and the ability to produce lightweight software applications and hardware implementations with minimal footprint, while producing comparable results, there are applications that will surely benefit from this combination of characteristics.
One important observation regarding QOI is the fact that there is a possibility of the image expanding after encoding. This can be observed when looking at the worst case in the presented summary tables of the current document. However, this only occurred in 14 cases out of a total of 2814 sample images, or in less than 0.5% of the dataset. The common thread between those cases leads to the observation that QOI is more sensitive to images containing random noise or noise-like patterns.
Finally, it is an important reminder that the work presented in this paper is focused on just one out of a plethora of factors one needs to take into account when determining the image format best suiting the needs of the application. Even when considering the compression ratio alone, only the common subset of functionality between the different codecs was examined in this work. An application aiming at an efficient encoding of a transparency channel, for instance, could benefit from utilizing PNG or QOI for that purpose, as the other formats would encode it as any other color channel, without accounting for a potentially reduced alpha component bit width. However, it is our hope that this effort has presented enough detail to effectively highlight the merits and disadvantages of each of the examined image formats.
Download the PDF of this paper to also see Appendix A: Results per Image Set.
References
[1] The Quite OK Image Format for Fast, Lossless Compression - Dominic Szablewski
[2] QOI Format official GitHub Repository - Dominic Szablewski
[3] FFMPEG Official Webpage – FFMPEG Developers
[4] QOI Benchmark Dataset - Dominic Szablewski
[5] The New Test Images Dataset – Rawzor
[6] Lossless Image Compression Ratio Benchmark GitHub Repository


